Application Troubleshooting and Debugging
Easily Collaborate Across Teams to Identify and Troubleshoot Hadoop Application Performance Issues
When things go wrong, you need to quickly get an idea of where the problem is in order to determine the fastest path to resolution. Is there something wrong with the code we just released? Do I have a resource issue on the cluster? How do I get control over all these ad-hoc queries that are putting our business critical applications at risk?
To really get to the bottom of an issue, it usually requires a cross-functional team to dig into it. DRIVEN provides visibility and business context all in a common view so everyone is working together to quickly identify the root cause and determine the best path to resolution.
Quickly Perform Failure Analysis on Your Big Data Applications
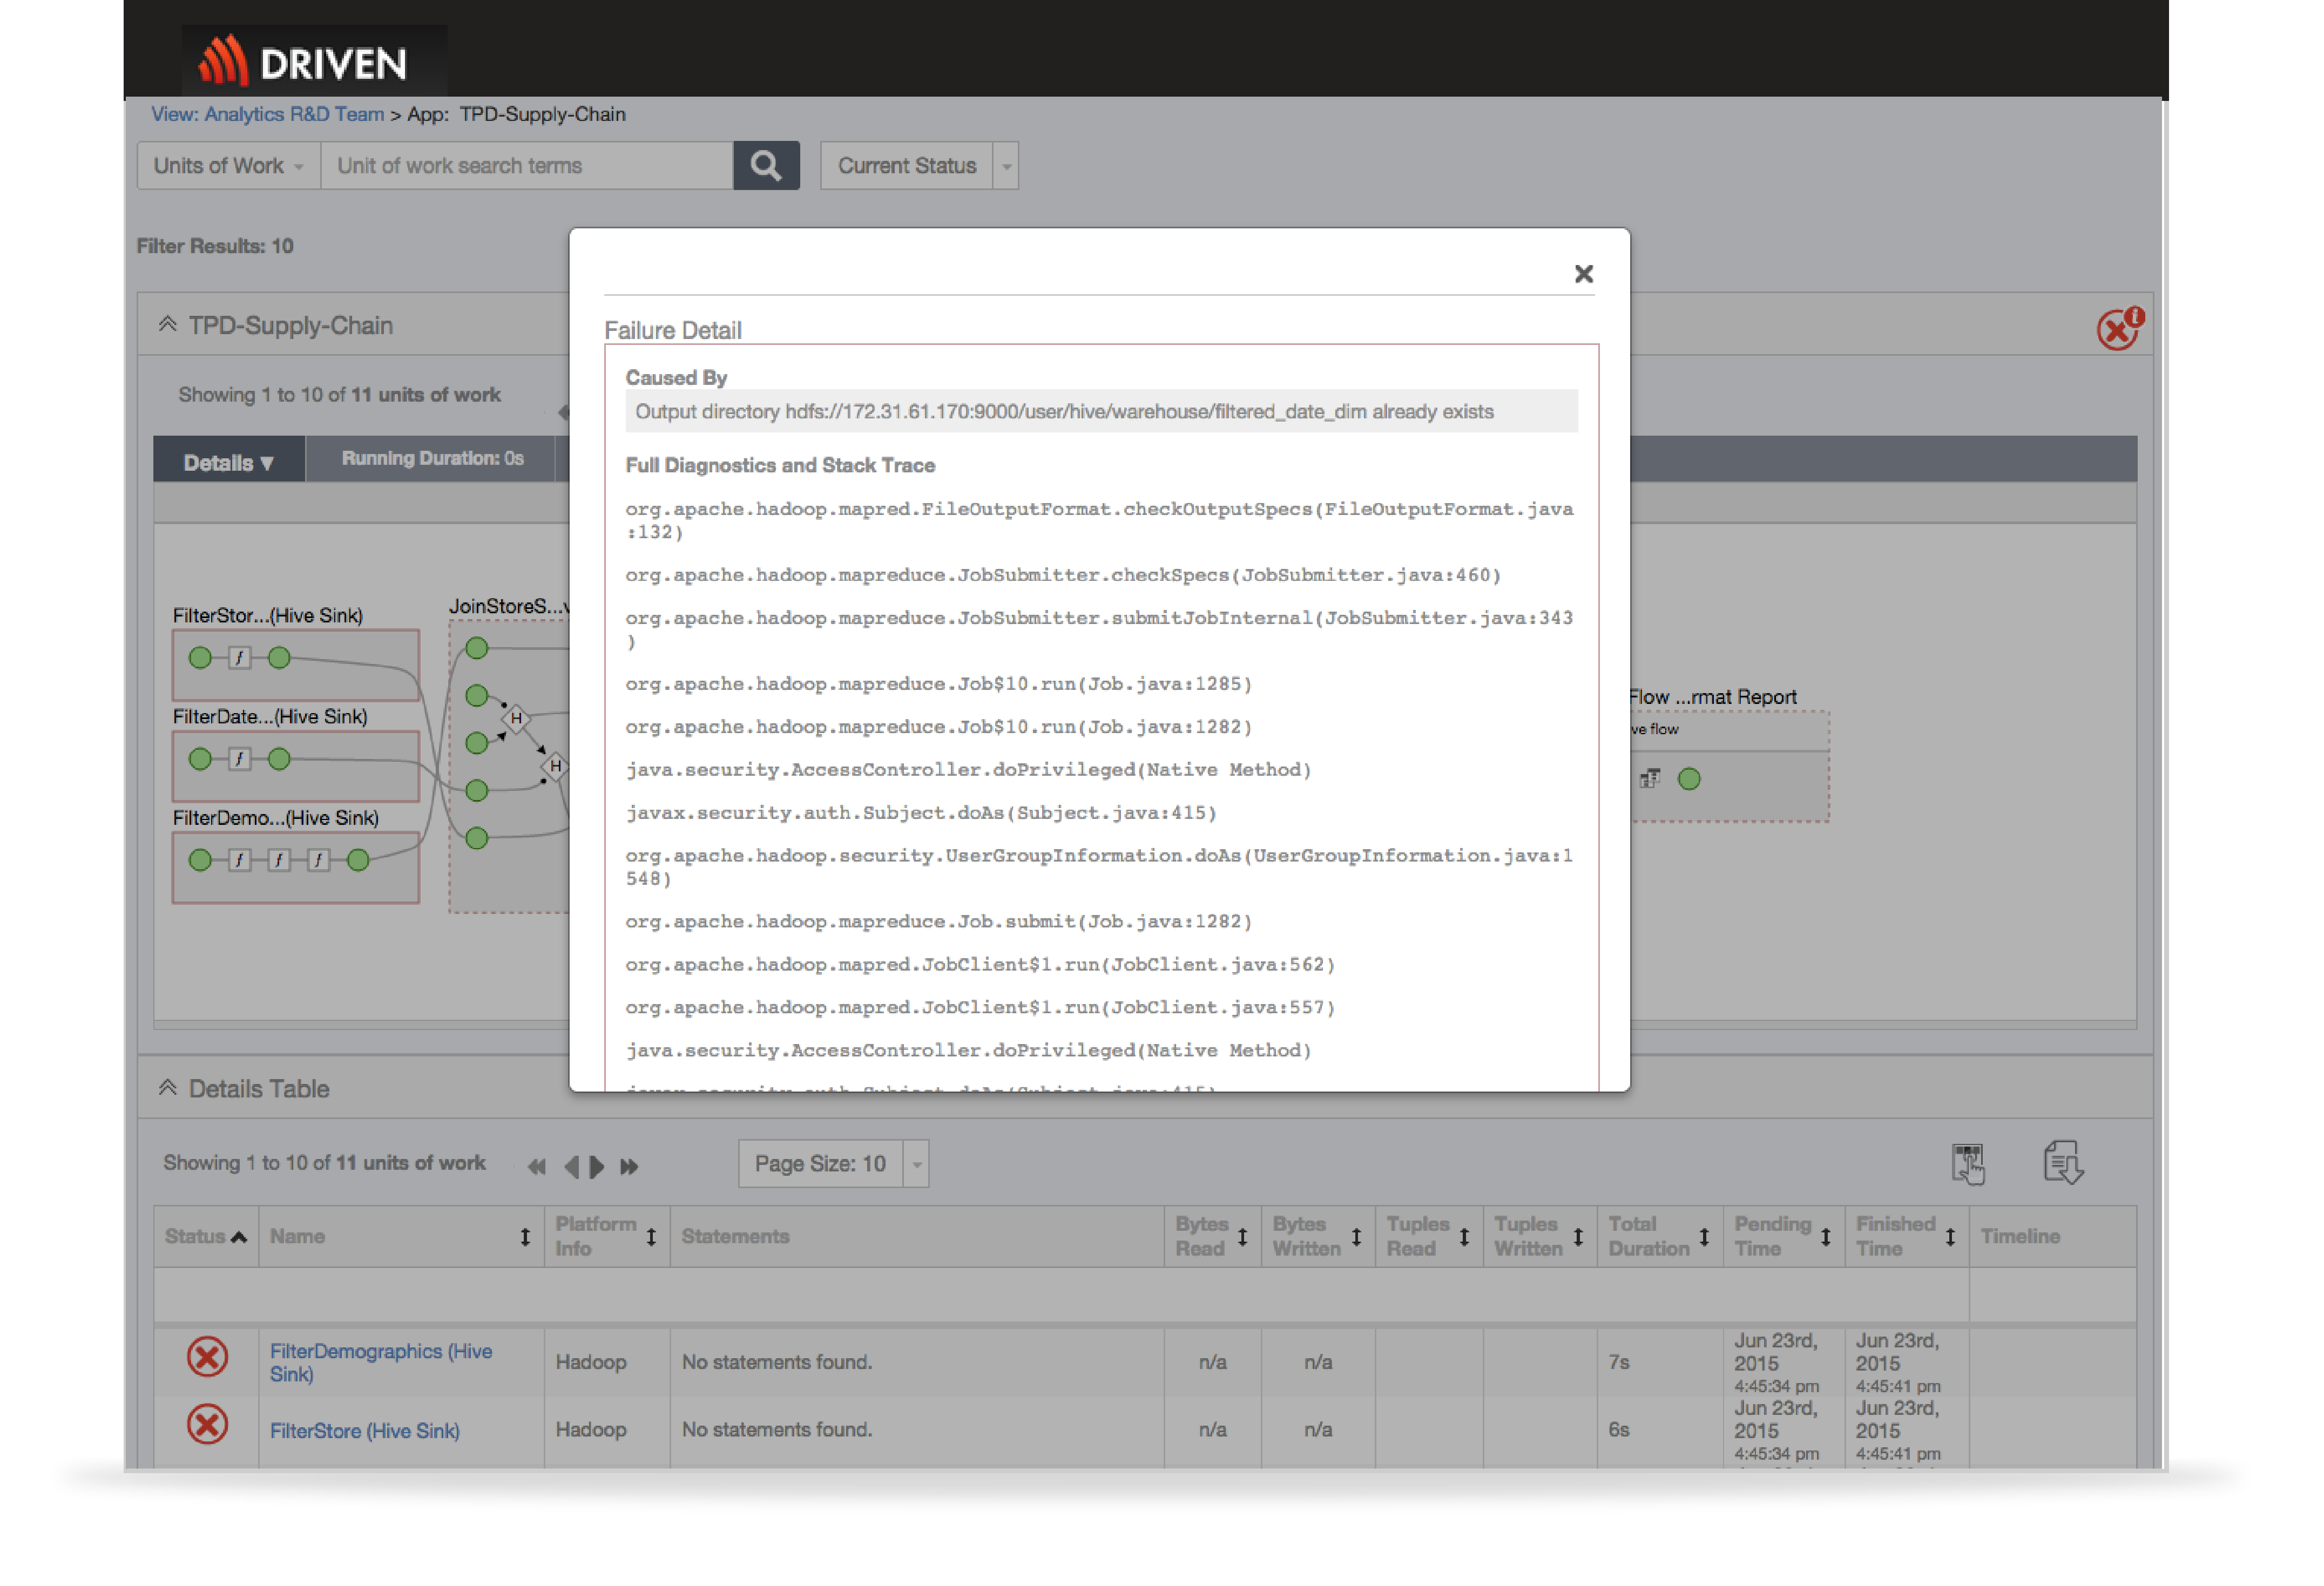
When something fails, most dev/ops teams have few options but to wade through logs files and code to try to find where and why an error occurred. DRIVEN changes the game. It provides the visibility needed to pinpoint a problem without ever looking at a log file (well, unless you want to).
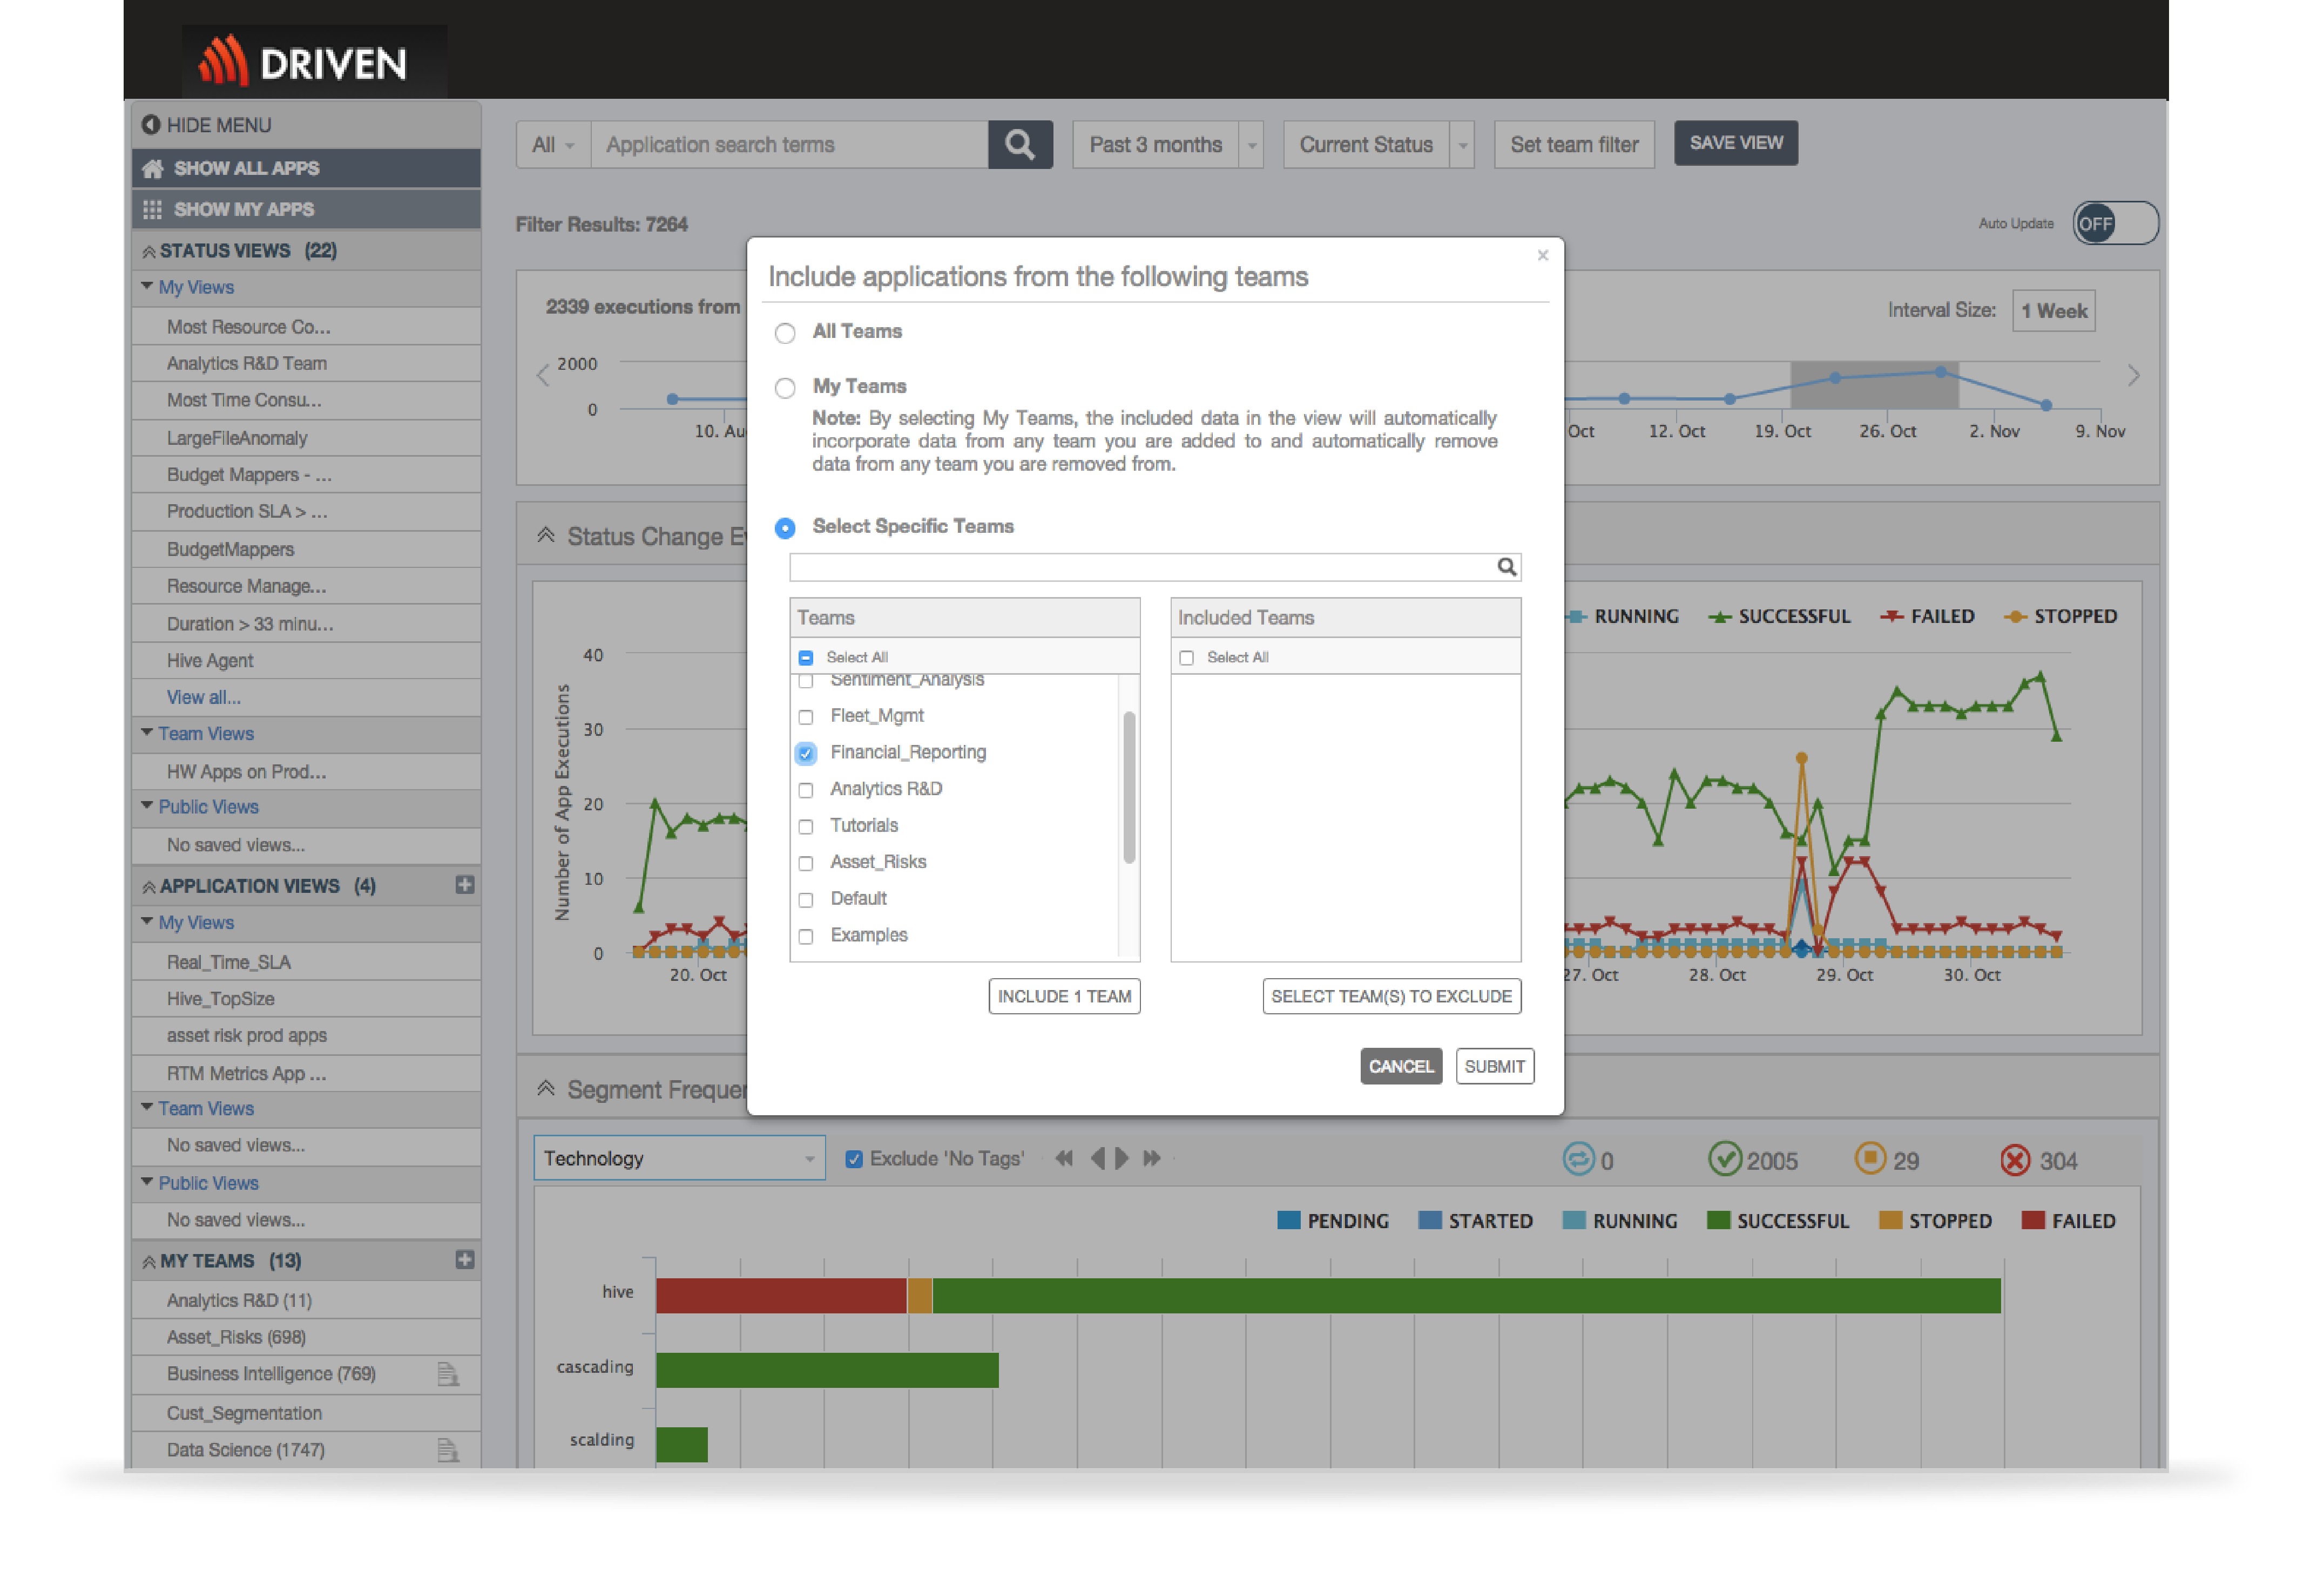
- Create cross-functional teams and share views so everyone works from the same data to identify and resolve issues
- All data is presented in a single view with drill down capability so teams can pinpoint where and when an issue occurred and what else was going on at the time
- Find the root cause of a problem in minutes, not hours. With a 1-click, surface the location of the failure and the stack trace.
- Easy to understand metrics provide quick guidance to where the problem is and robust visual debugging capabilities uncover the root cause
Surface Application Bottlenecks and Anomalies
Before you can troubleshoot anything, you need to understand how your applications actually behave at runtime. With DRIVEN, a vast amount of application performance metrics and metadata are captured and stored so you to get the full picture you need.
- Rich performance metrics are collected for each data process, such as start time, duration, pending time, data written/read and custom-defined metrics
- Teams can quickly drill down into problematic data processes and set counters, or create their own custom counters, to help troubleshoot and determine the root cause of the issue
- See the details that matter to you. In seconds, go from finding which data processes are consuming the most resources to diagnosing all failed applications in the last 5 hours.

Analyze Performance Trends
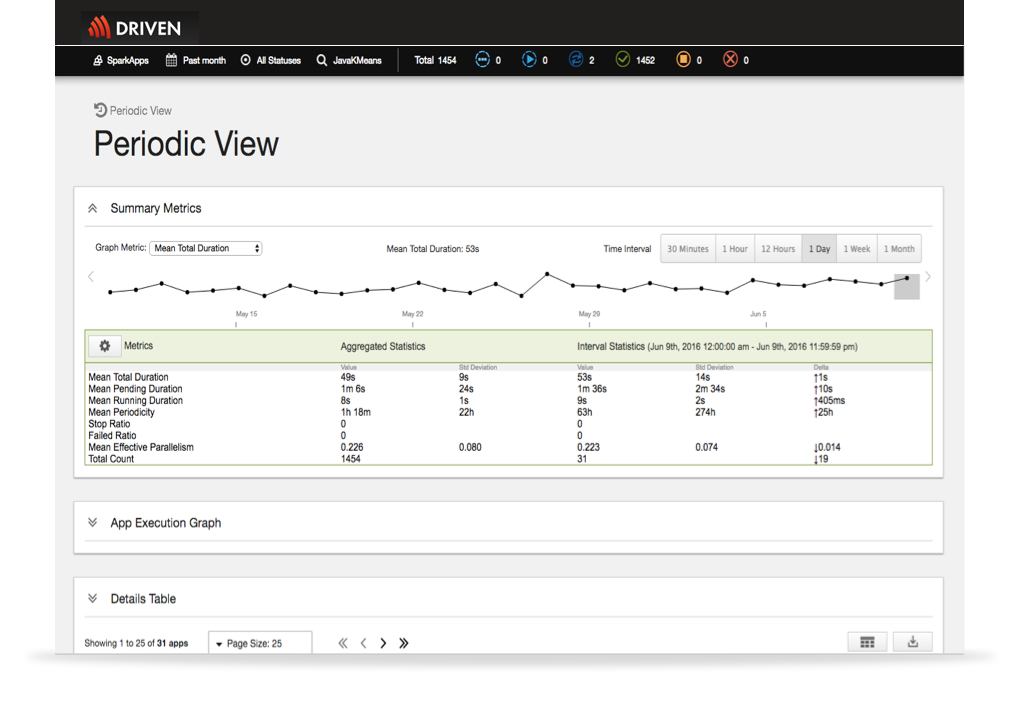
To consistently deliver a high quality of service, it is important to monitor past and present performance of your business critical applications. DRIVEN enables you to see past and present performance and surface key metrics to help you understand performance trends over time.
- Visualize each unit of work and how long each step is taking and what resources it is consuming
- Observe performance skews and quickly determine if its your code, your data, your network, your hardware, or your cluster configuration causing the issue
- Identify hot spots, slow downs, frequent failures that occur in your applications and determine if it is a one-off issues or a reoccurring problem
- Use historical performance metrics to understand performance trends and quickly determine what SLA’s you can realistically achieve


