Application Performance Monitoring and Big Data APM Metrics
Big Data Performance Monitoring. Get the Visibility You Need to Manage Your Multi-tenant Hadoop with Ease
As business demands superior service levels, organizations realize their Big Data applications have moved from experimentation to achieving costs savings, driving innovation and revenue growth. Business teams have little tolerance for slow or failed delivery of their data. As Big Data applications move into production, operations teams quickly realize they need more robust insights into application performance than cluster management tools provide. DRIVEN provides those insights by collecting and surfacing key application performance metrics and metadata that cluster monitoring solutions simply do not capture. With support for all the major Big Data technologies, DRIVEN enables teams to execute Big Data performance monitoring for all of their applications in a single, comprehensive, solution.

Real-Time Operational Visibility
You can’t manage what you can’t see. DRIVEN provides complete visibility of into data processing applications and their run-time performance so teams know exactly what is happening across their entire environment at all times.
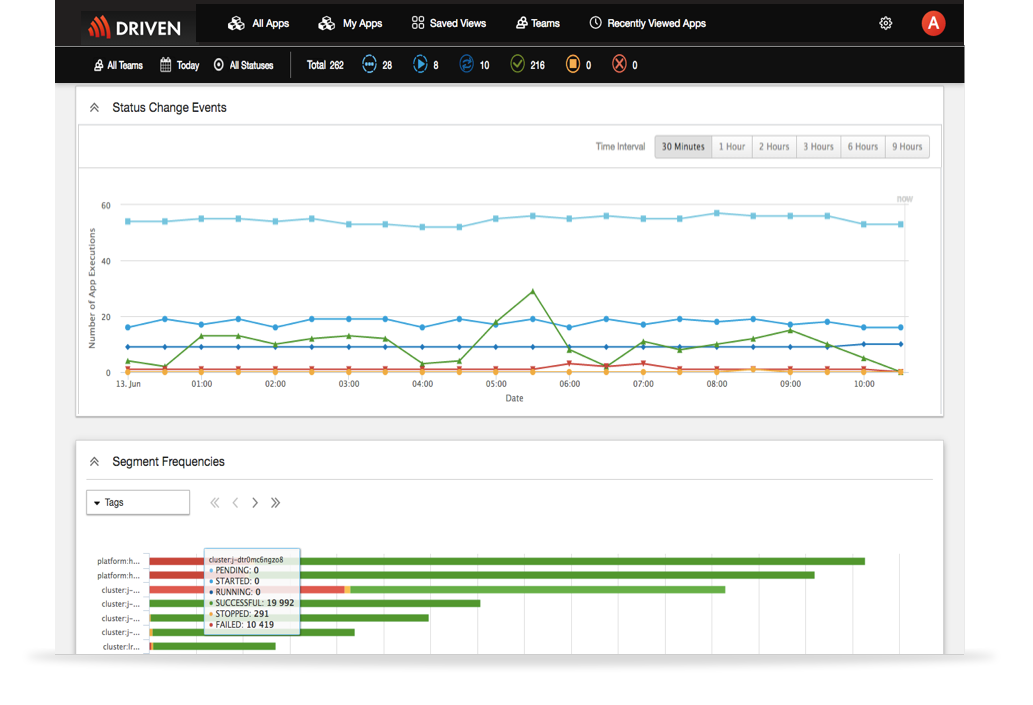
- Immediately see the real-time status of your applications, including succeeded, failed, running, and terminated applications, and resource consumption across all clusters
- Segment applications using collected metadata and clearly what teams are running what applications and what applications are consuming what resources, all in real-time
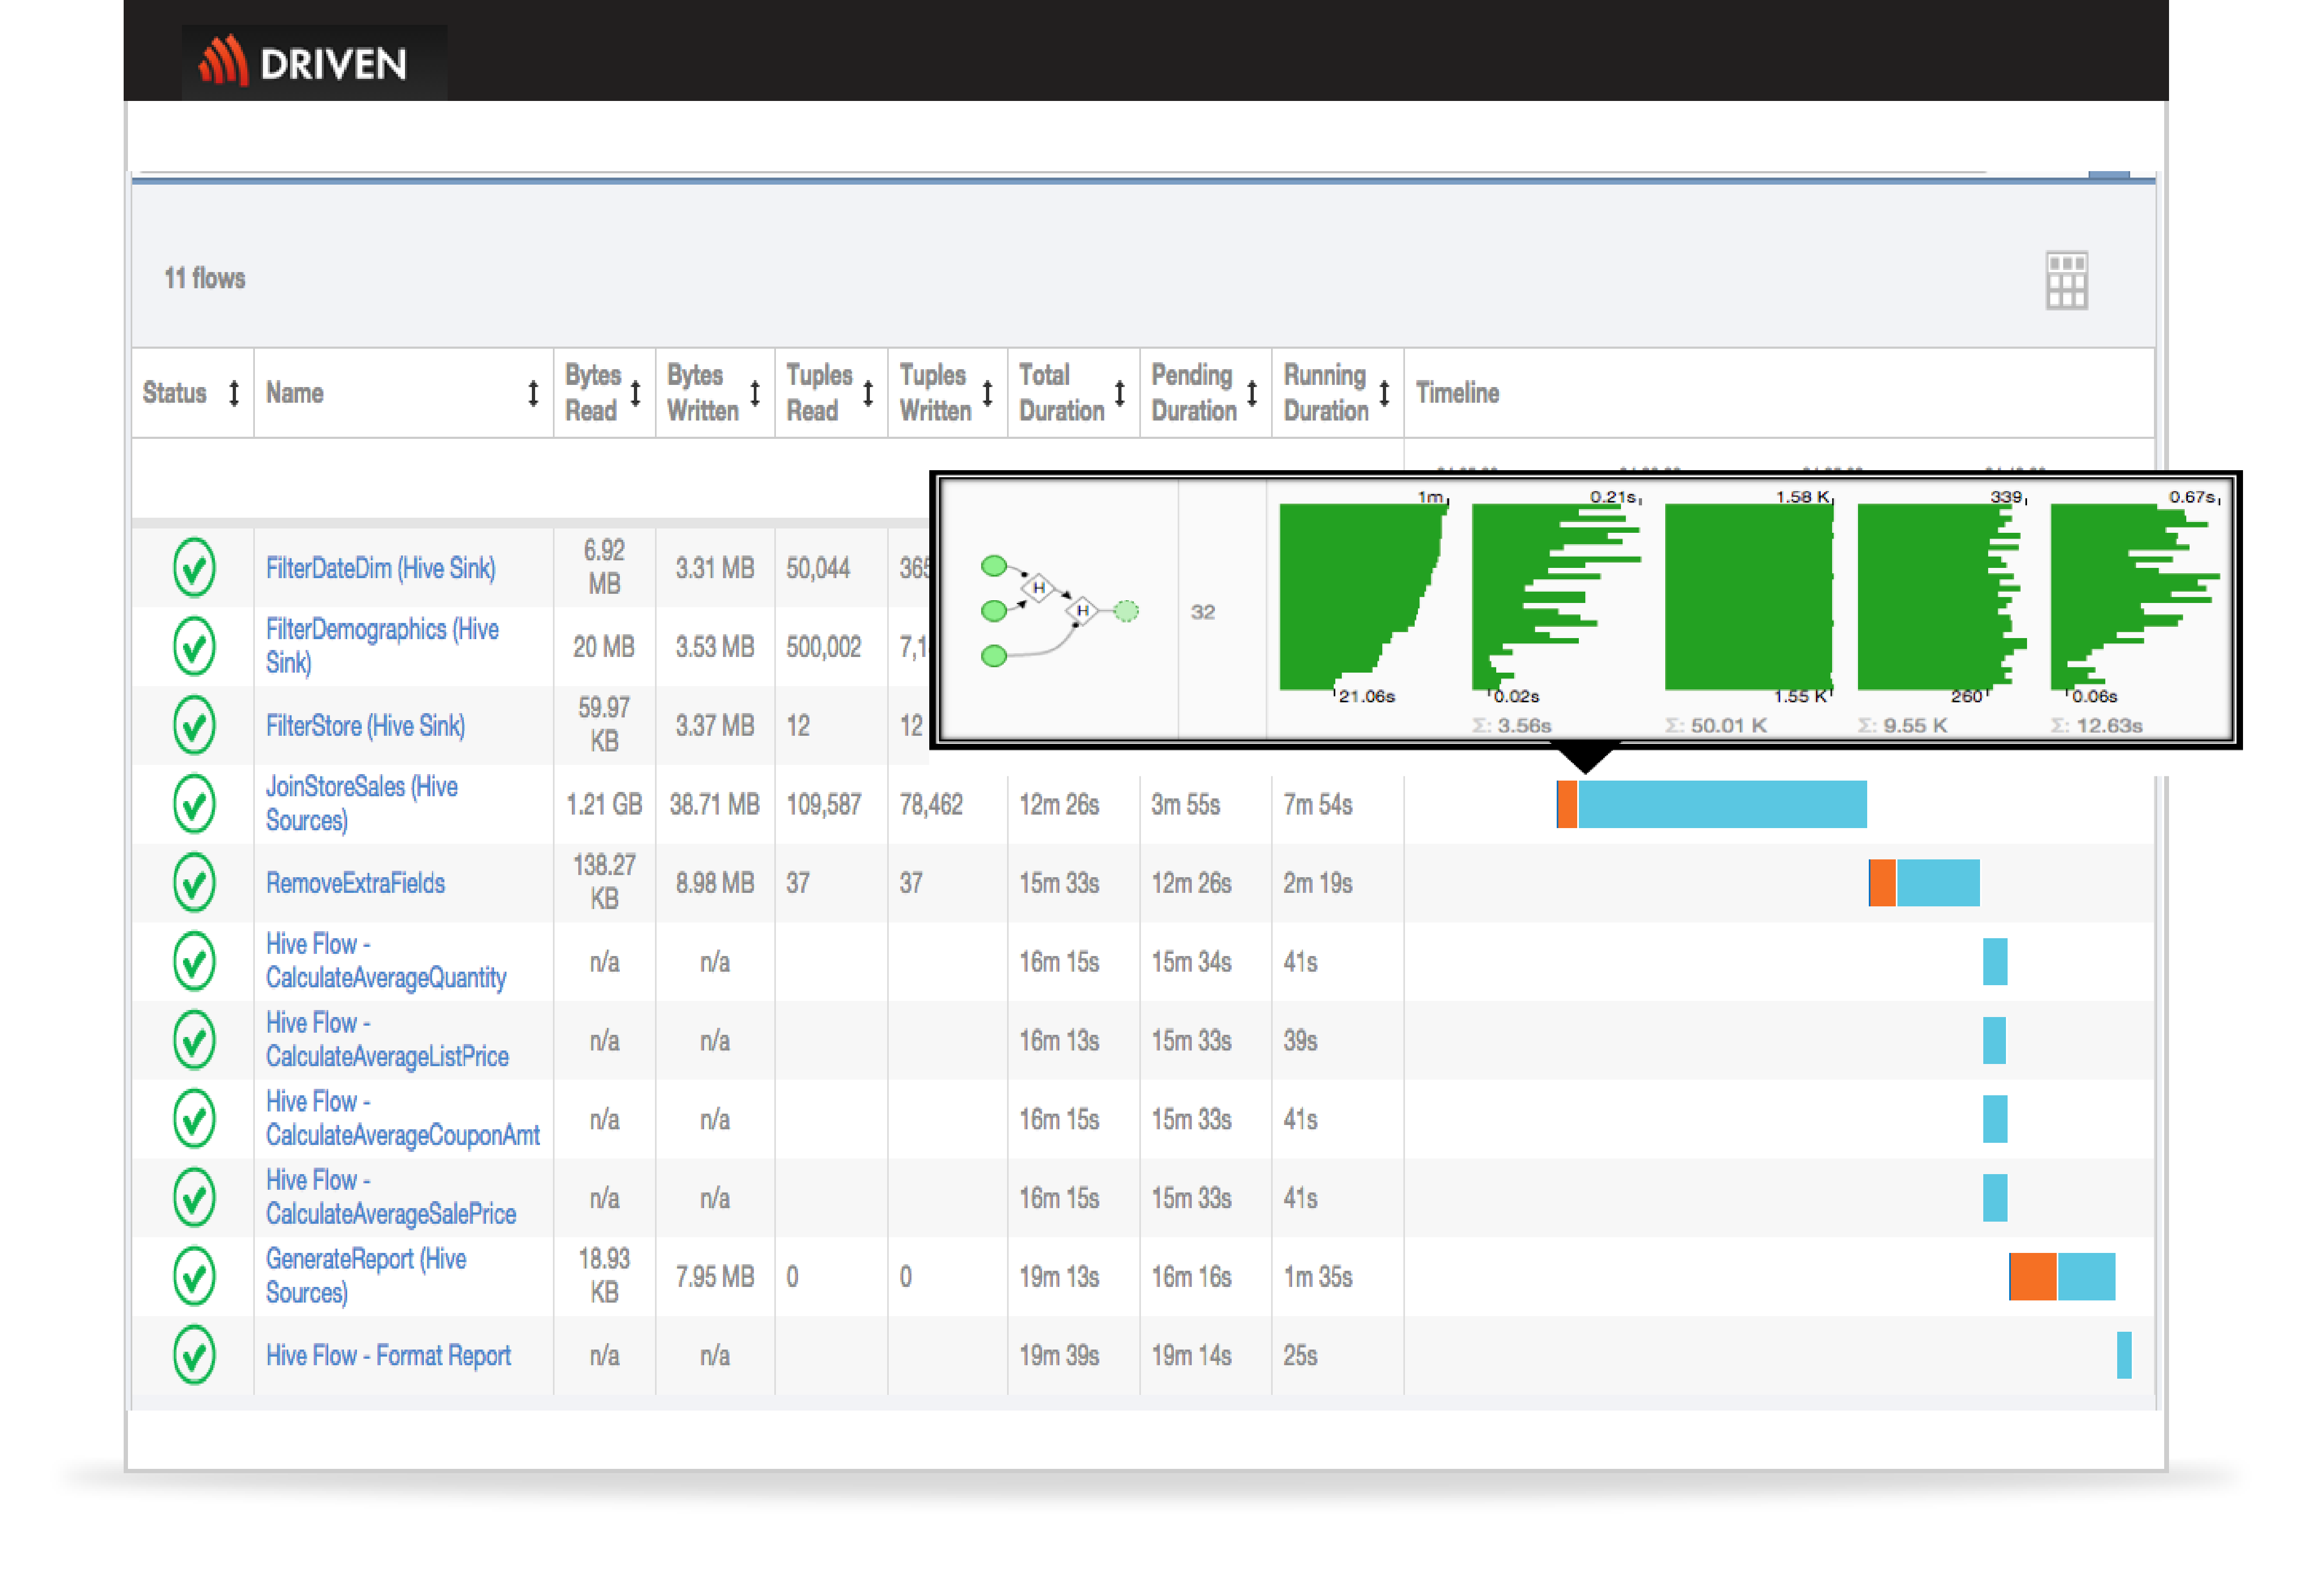
- Rich performance metrics are collected for each data process, such as start time, duration, pending time, data written/read and custom-defined metrics
- Easily analyze an individual processes performance metrics for variations and anomalies over time
See How Your Big Data Application Really Behaves
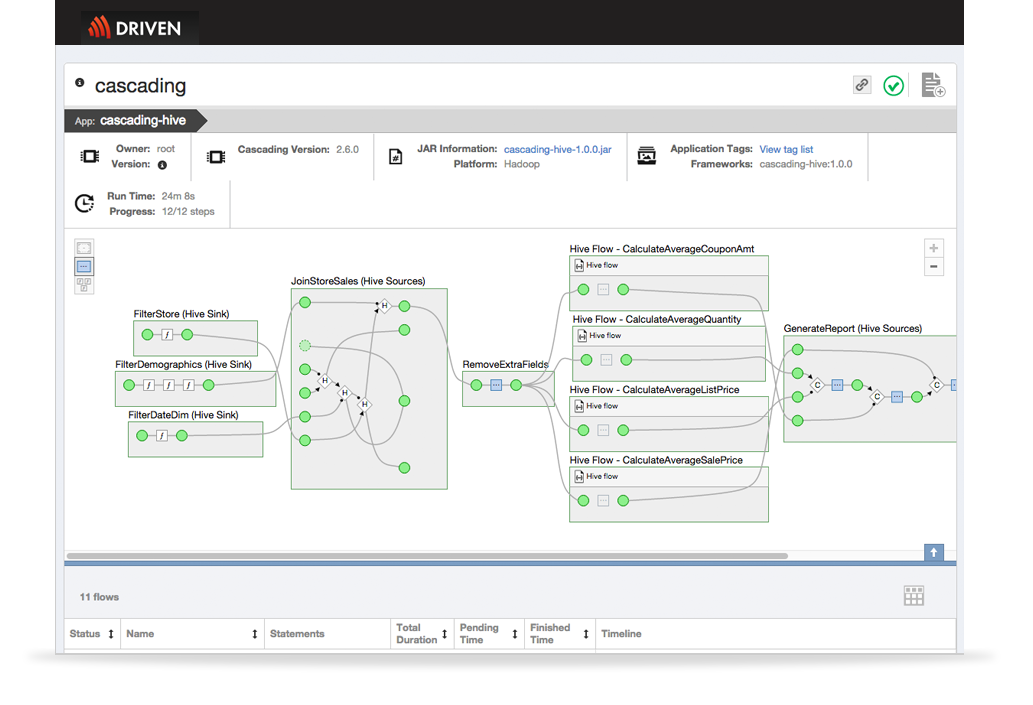
To troubleshoot and optimize application performance, you need to be able to visualize the entire data pipeline in a single view. DRIVEN visualizes your entire data pipeline and drills down into the execution details.
- Quickly visualize your entire data pipeline as a directed acyclic graph (DAG) and see the details of each step such as source, function, join, HQL query, etc.
- See all the detail of the run-time execution of your Hive, MapReduce, Cascading or Spark applications
- Use the DAG to architect, debug and quickly finding the root cause for slow downs or failures in your data applications
- Take the guesswork out of troubleshooting by seeing the exact step your process failed


Optimize Performance
Visualizing where your application is spending the most time is essential to quickly identifying and addressing potential performance bottlenecks or anomalies.
- Visualize each unit of work and how long each step is taking and what resources it is consuming
- Use performance metrics to observe skew and quickly determine if its your code, your data, your network, your hardware, or your cluster configuration causing the issue
- Powerful search allows you to filter by almost anything and create custom views
- Select from a long list of available metrics or create your own custom metrics to monitor your environment in a way that makes sense to you.
Performance History and Statistics
Identifying when a performance problem started requires access to performance history and vital statistics about past data processing application runs.
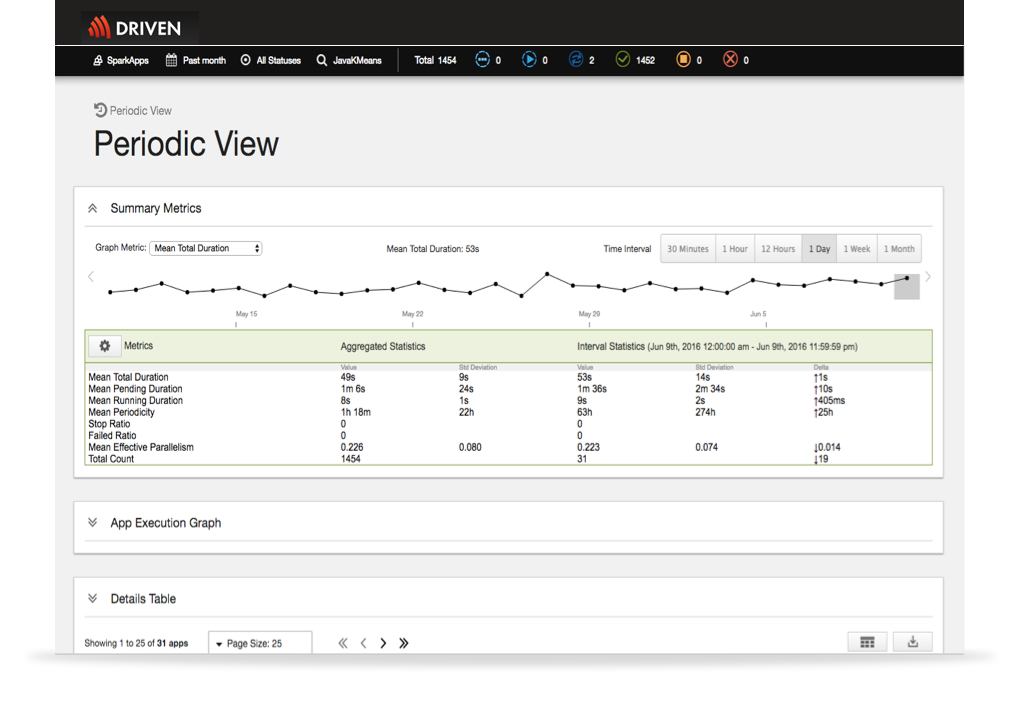
- Compare key execution metrics trends over time
- Quickly detect anomalies by visualizing historical data application state transitions
- Analyze trends to determine if an issue is a one-off or reoccurring and identify related conditions
- Create specialized custom views or export historical data to satisfy multiple reporting needs: chargeback analysis, capacity planning, compliance audits, etc.

